East Perry · Ecommerce case study
From $395,821 to $2.57M in annual Shopify revenue.
Inside ROI.LIVE's work with East Perry: a growing sheepskin brand, a rebuilt storefront, and a closer look at what each marketing dollar supports.
For the responsibilities behind ongoing storefront work, see Shopify store management and optimization. The case below distinguishes the work delivered from the business results observed.
2022 reported baseline → 2025 calendar-year revenue. Store-level results across the business, not a measure of revenue caused by ROI.LIVE alone. Source and calculation notes

01 / The business record
Growth you can trace, year by year.
East Perry's KPI workbook records $2,566,016.62 in Shopify Revenue for 2025. That is about 6.5 times the workbook's $395,820.73 prior-year baseline for 2022.
The intervening years matter. Revenue reached $900,441.77 in 2023 and $1,898,839.07 in 2024. The record shows a business growing across several calendar years, with marketing and the store experience developing alongside it.
An early six-figure month.
September 2023 recorded $103,510.72 in Shopify Revenue. It is the first month above $100,000 in the workbook's available July 2022–February 2026 history.
02 / The work behind the numbers
Help shoppers choose a sheepskin product.
East Perry sells tactile products online. Shoppers have to judge a rug's texture, understand a product's care requirements and compare its uses through a screen. Product imagery and useful answers belong in the same marketing plan as search and advertising.
ROI.LIVE's work across the relationship has included fractional CMO support, SEO, Google and Meta advertising, email/SMS and the Shopify redesign. Service responsibilities changed over time. The business totals above cover all channels and teams, including work outside ROI.LIVE's management.
The case records a connected set of tasks: attract relevant visitors, give them enough product information to decide, support later purchases and examine the economics. The records below make those tasks concrete.
Search and advertising
Organic search work and paid campaigns supported product discovery. The channel reporting identified attributed sales and ad spend so the client could assess the cost of acquiring that demand.
How ROI.LIVE approaches SEOThe Shopify storefront
The website work addressed product FAQs, image framing, reviews, navigation and related products. Each affects what a shopper can understand or do before placing an order.
Explore website designReporting with cost context
The March 2026 correspondence moves from channel totals to product-level advertising questions. That is where growth reporting becomes useful to the person deciding what to promote next.
See the fractional CMO role03 / The store redesign
A closer look at the buying experience.
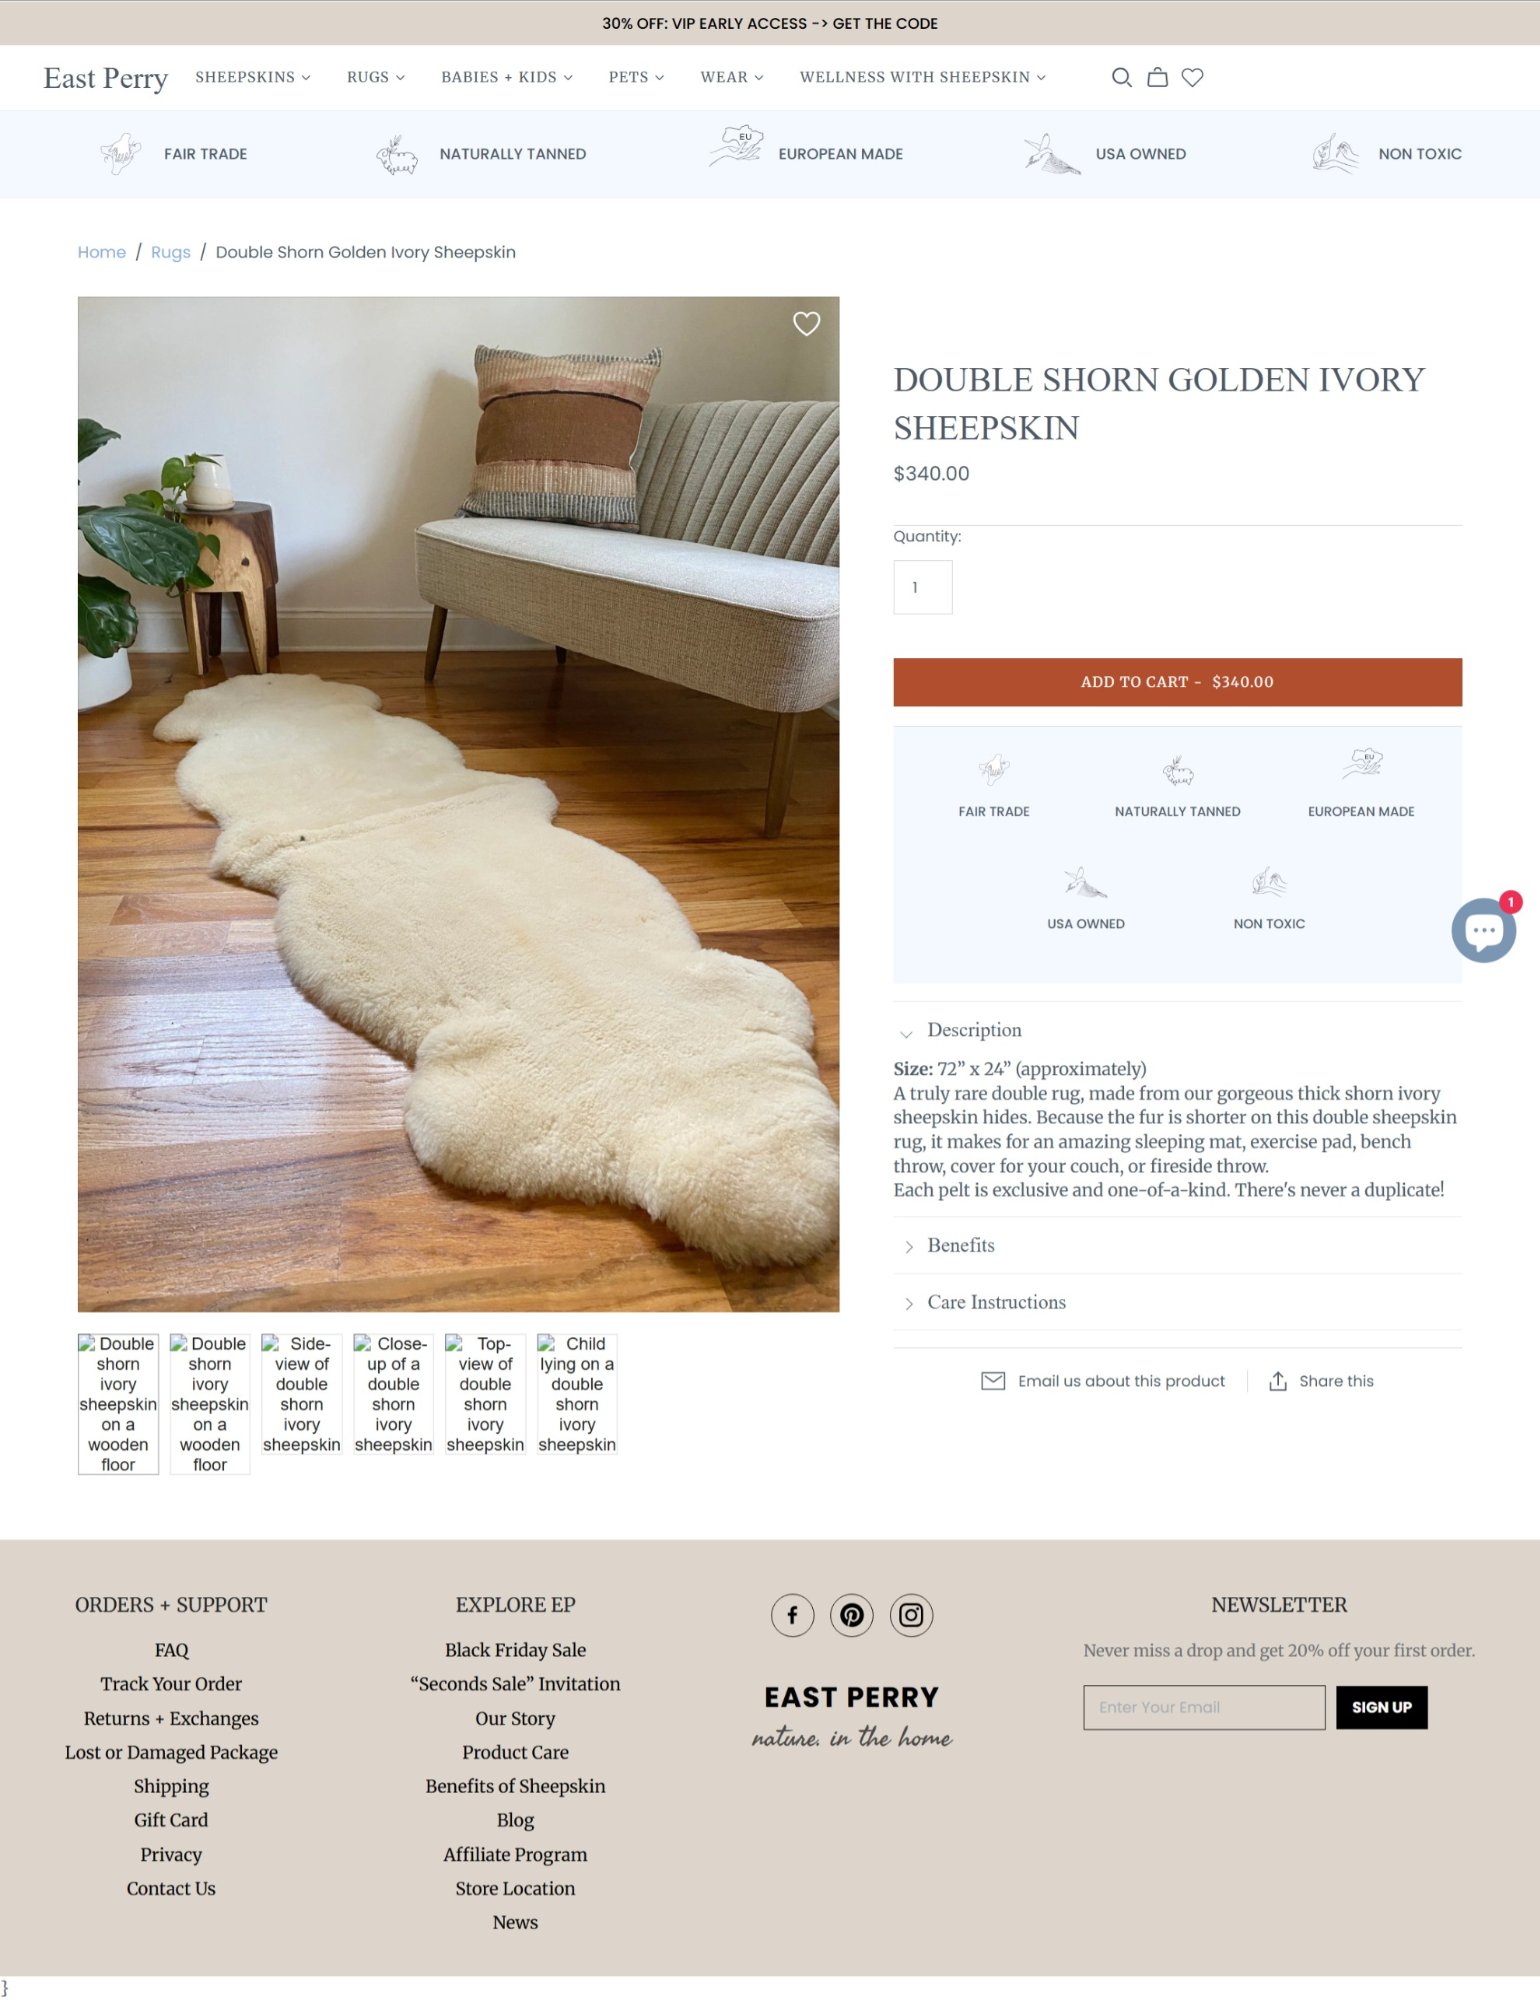
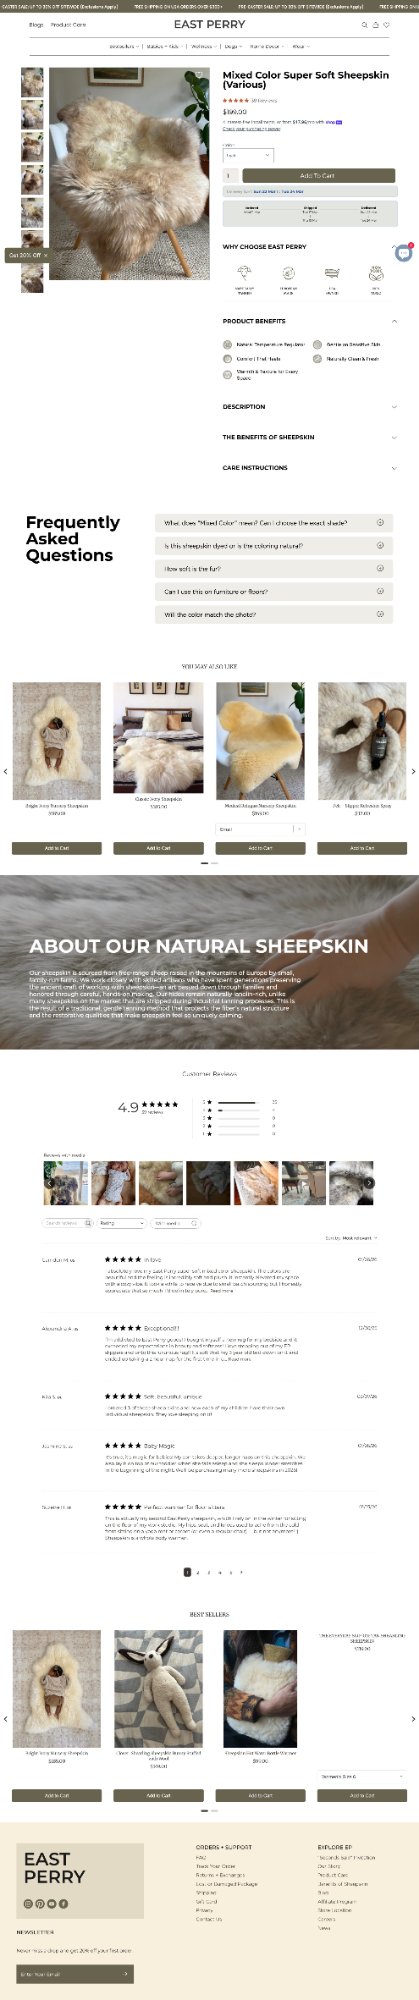
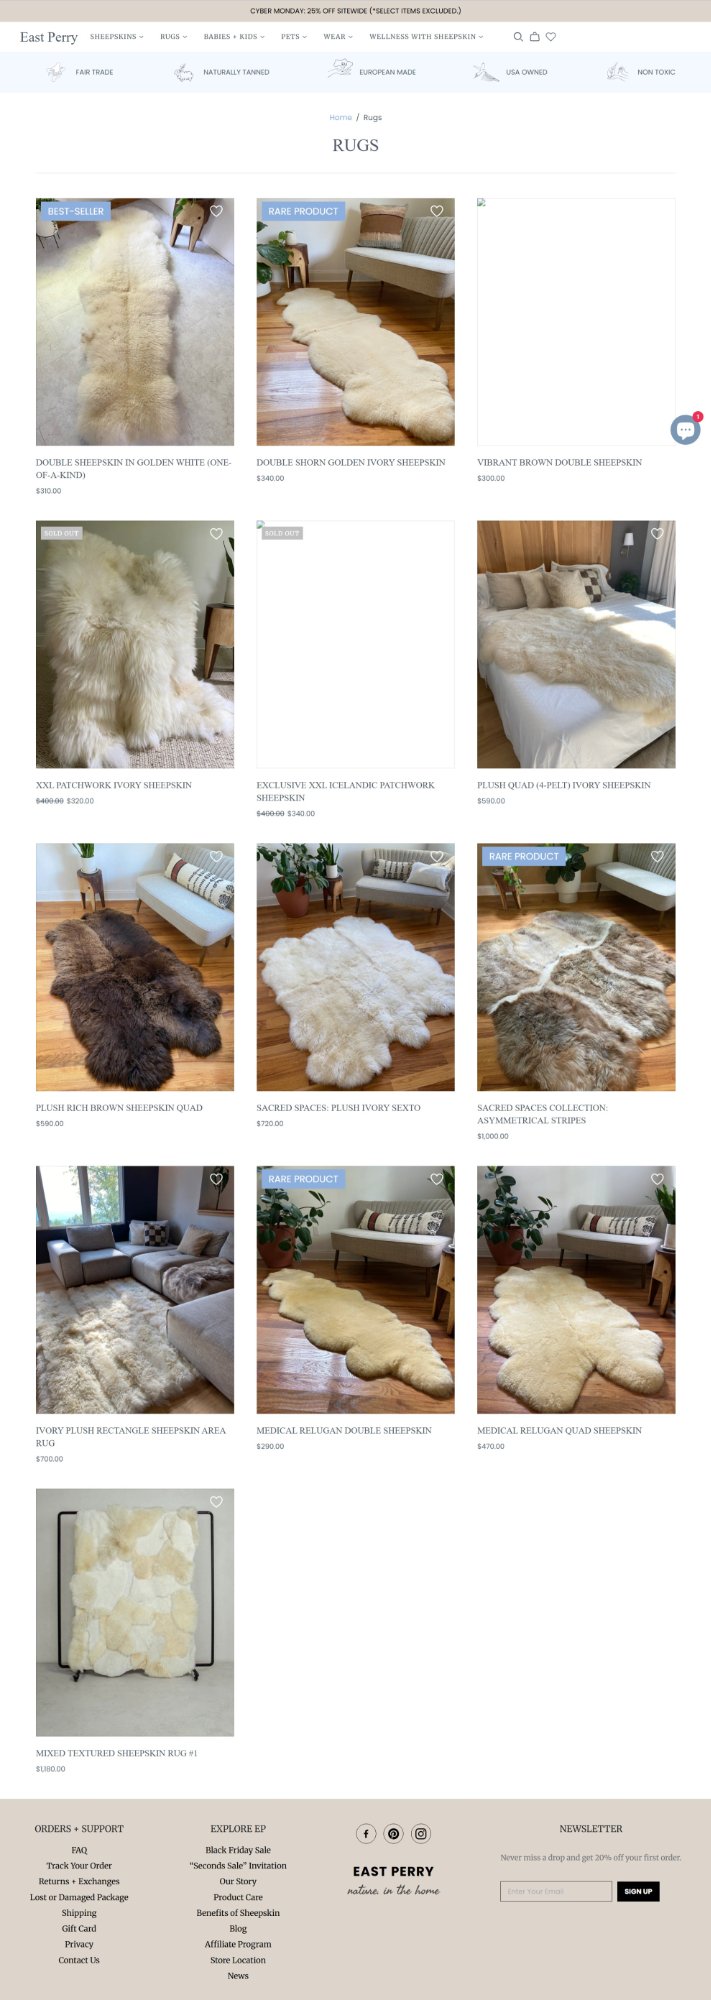
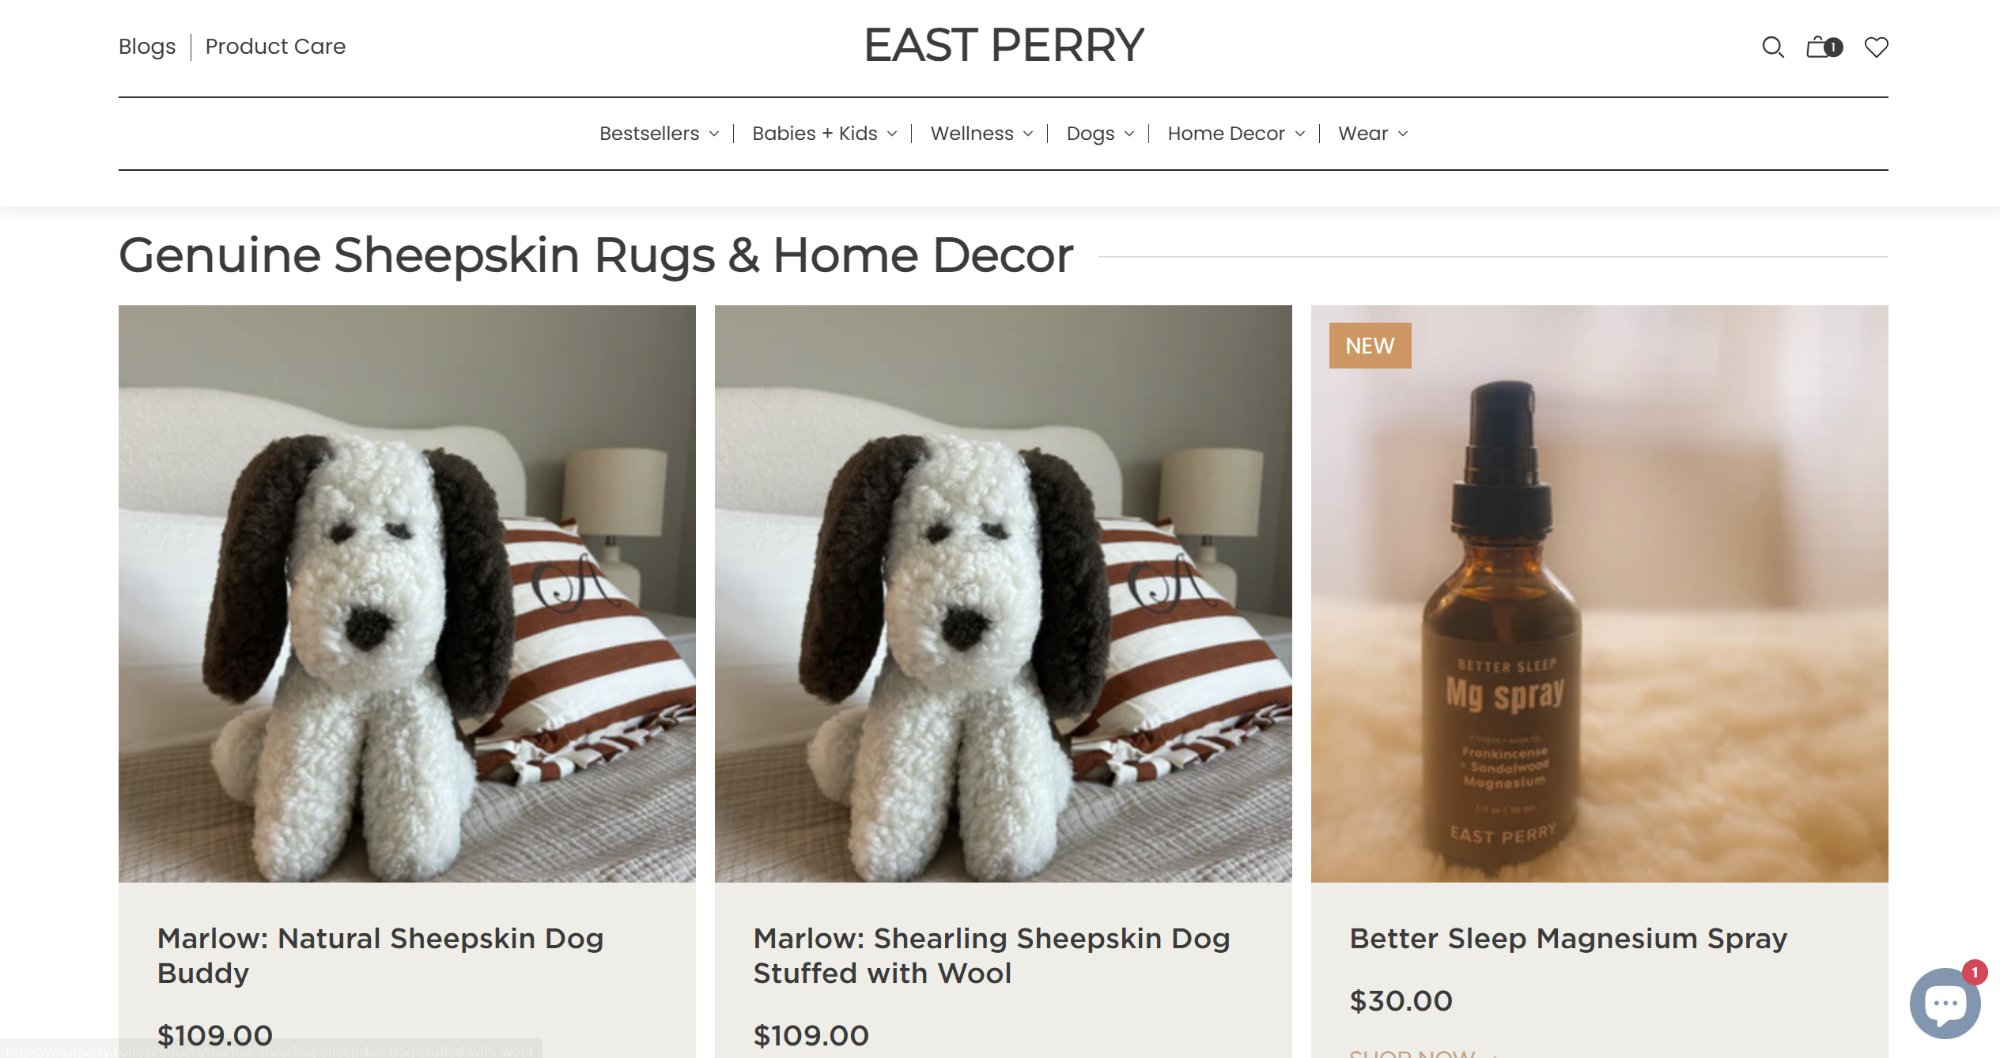
The archived redesign shows fuller product pages, revised navigation and larger product presentation. The earlier site already had lifestyle imagery and customer reviews. The useful comparison is how those elements work together and where a shopper finds the next answer.
At the December 4, 2025 prelaunch review, Janine Saunders described the new website as beautiful while the team discussed final revisions.
Product-page comparison
From product details to a fuller decision page.
Read both pages as a shopper: what can you see, what questions get answered, and how do you choose the right product?
The earlier product capture shows a main image, purchase controls and care information. The revised example adds prominent FAQs, related products and a longer customer-review section. The two captures show different products and viewport sizes; they document page structure rather than a controlled performance test.
The review went down to individual shopping tasks.
The December 15 internal review records work on mobile search, image crops, product FAQs and category links. The team checked how shoppers reached product care information, how collection images displayed and how staff could update collection videos.
The notes also preserve unfinished items, including review styling and product-specific blog recommendations. That distinction matters: a discussed feature is not evidence of a finished release. The case uses the archived store captures to show the resulting design and the meeting record to explain the work.
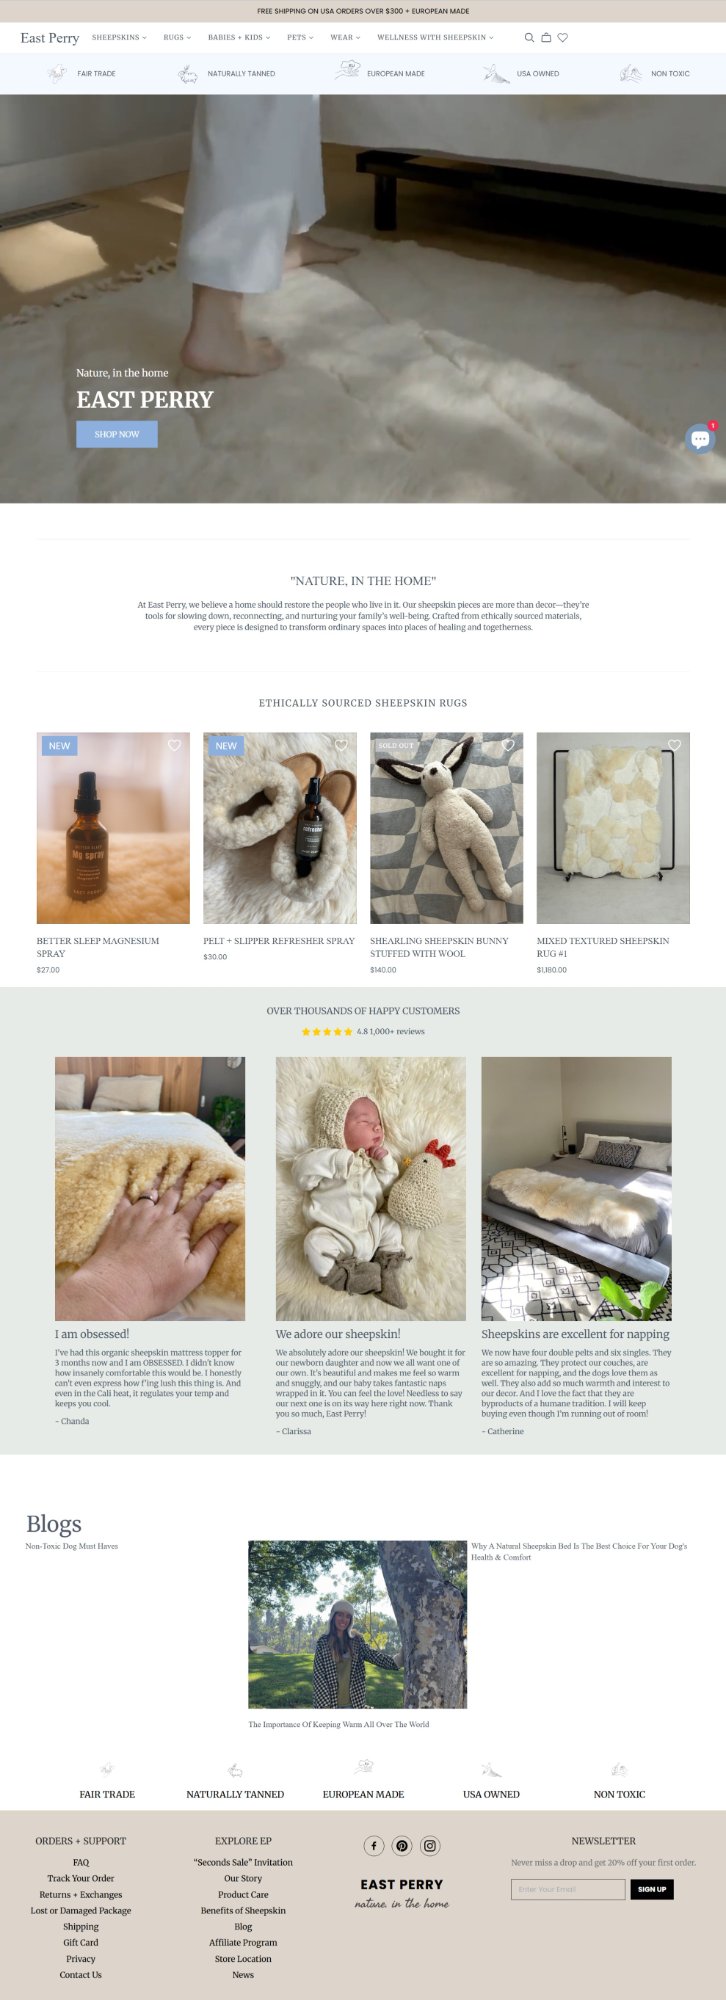
See the archived homepage and collection views
Earlier and redesigned store views. Screenshots show the pages, products and prices at the time of capture.
Homepage and collection-led store view
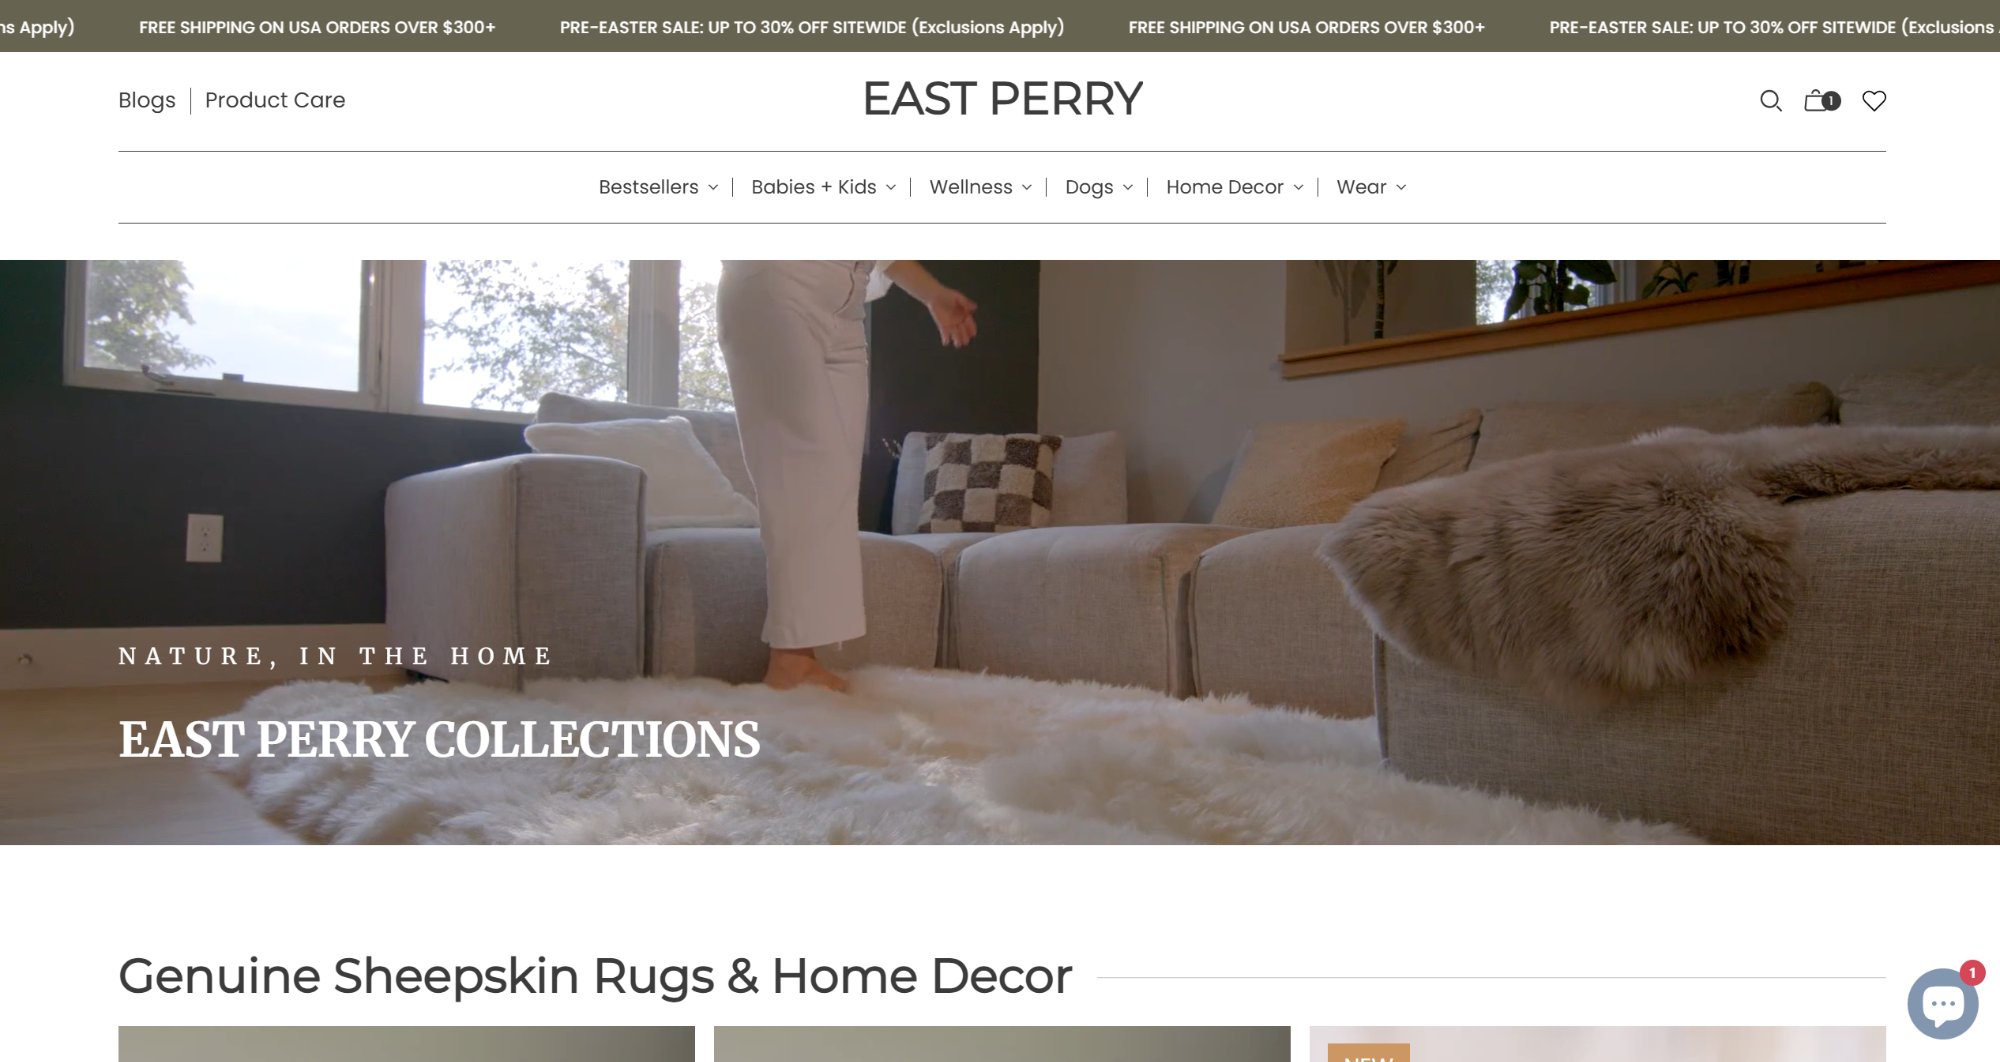
Collection browsing
- 01Recognize the product
See the sheepskin’s texture, shape and scale in the product photography.
- 02Check the fit
Compare the description, care guidance, FAQs and related items in the archived page views.
- 03Decide with context
Read the customer reviews and purchase information before choosing a product.
What changed in the store’s design.
04 / The next reporting period
A stronger start to 2026.
January–February Shopify Revenue rose from $298,156.62 in 2025 to $485,049.61 in 2026. The same two calendar months produced $186,892.99 more revenue.
Total Shopify revenue across the store, before business expenses.
2026 versus 2025
05 / Fractional CMO work in practice
The client asked which products paid their way.
In March 2026, Jeremy asked for advertising data by product. A store can produce more revenue while individual products have different economics. The report needed to show which costs could be connected to a specific item.
ROI.LIVE's March 8 response identified about $110,000 of the roughly $202,000 in 2025 Google ad spend as Shopping spend that could be allocated by product. About $92,000 came from Search, Display, YouTube and Performance Max placements outside Shopping; the report could not assign that portion to individual products.
What product-level reporting could explain
2025 Google ad spend · roundedShopping spend
Could be allocated by product.
Other Google placements
Not assigned to individual products in this report.
Revenue per ad dollar, with the costs kept visible.
The same agency email reported $990,101 in SegMetrics-attributed Google revenue against $202,092 in Google ad spend for 2025. Meta's figures were $234,916 against $65,452. Google returned a reported $4.90 in attributed revenue per advertising dollar; Meta returned $3.59.
Those ratios measure attributed revenue divided by media spend. They do not deduct product costs, agency fees, shipping, payment fees or operating overhead. Channel attribution also answers a different question from the Shopify store total, so the figures should not be added together.
| Channel | Attributed revenue | Ad spend | Revenue / ad spend |
|---|---|---|---|
| Google Ads | $990,101 | $202,092 | 4.90× |
| Meta Ads | $234,916 | $65,452 | 3.59× |
06 / What an owner can take from this
Keep the business result and the decision together.
East Perry's case connects a multi-year revenue record with tangible store work and detailed client reporting. For an ecommerce owner assessing an agency, each provides a different kind of evidence.
The revenue series shows what happened across the business. The product-page captures show the design work. The March correspondence shows how ROI.LIVE answered a financial question that headline advertising ratios could not settle.
Ask a prospective partner to make those connections in your business: which buyer question a page will answer, which channel a report credits, what the cost calculation includes and what decision follows. Our ecommerce marketing approach explains how the work fits together.
Source notes
What these figures measure.
Sources: East Perry’s Shopify KPI workbook, March 2026 advertising report and December 2025 website reviews.
The public notes below explain the periods and calculations without exposing private customer orders, email addresses or internal account access.
Annual revenue and the 2022 baseline
The KPI workbook reports a 2022 revenue baseline of $395,820.73. Full calendar-year Shopify revenue was $900,441.77 in 2023, $1,898,839.07 in 2024 and $2,566,016.62 in 2025—about 6.5 times the 2022 baseline.
Figures cover the whole store, before business expenses.
Download the four annual figures and source definitions (CSV)September 2023 and January–February 2026
January–February revenue grew from $298,156.62 in 2025 to $485,049.61 in 2026, up 62.7% over the same two months.
Advertising attribution and product costs
Source: East Perry’s March 2026 paid-advertising report. Revenue is attributed by SegMetrics; spend covers media charges.
The cost-of-goods method used a weighted estimate from available Shopify cost-per-item entries. Missing costs and a possible variant-entry error limit the contribution calculation. This page therefore reports revenue / ad spend and explains the cost work without claiming audited net profit, an all-in marketing return or an industry ranking.
Website evidence and client feedback
The screenshots show earlier and redesigned store pages. Client feedback comes from the December 4, 2025 prelaunch review.
Questions about the case
A few details worth separating.
What did East Perry achieve?
East Perry's KPI workbook records $2,566,016.62 in Shopify Revenue for 2025, compared with a $395,820.73 baseline for 2022. It also records a 62.7% increase for January–February 2026 versus the same two months in 2025. These are results across the store, not revenue attributed to ROI.LIVE alone.
What work did ROI.LIVE do for East Perry?
The relationship has included fractional CMO support, SEO, paid advertising, email/SMS and a Shopify redesign. The case shows archived store changes and client correspondence about channel performance and product-level advertising costs. Management responsibilities changed over time; the business totals include all channels and teams.
Does the 62.7% increase prove the website redesign caused more sales?
No. The 62.7% increase compares total Shopify revenue for January–February 2025 and 2026. It reflects the whole store, including advertising, products and customer demand.
What does the reported 4.90× Google advertising return mean?
The March 8, 2026 agency report divides $990,101 in 2025 SegMetrics-attributed Google revenue by $202,092 in Google ad spend. It means about $4.90 in attributed revenue per media dollar. It does not deduct product costs, agency fees, shipping, payment fees or overhead and is not net profit.
How can I discuss this approach for my ecommerce business?
Book a free 15-minute growth call with ROI.LIVE to discuss your goal, current marketing and next decision. The call includes a brief written summary. Detailed investigation, ongoing work and website projects follow an agreed scope.
Your next decision
Give your growth plan this level of attention.
Bring the goal, the current marketing picture and the decision you need to make. Your free 15-minute growth call includes a brief written summary. Detailed investigation and delivery are scoped after that conversation.
Start with Jason